
3/196 The Parade
Report menu jump to sections
Executive Summary
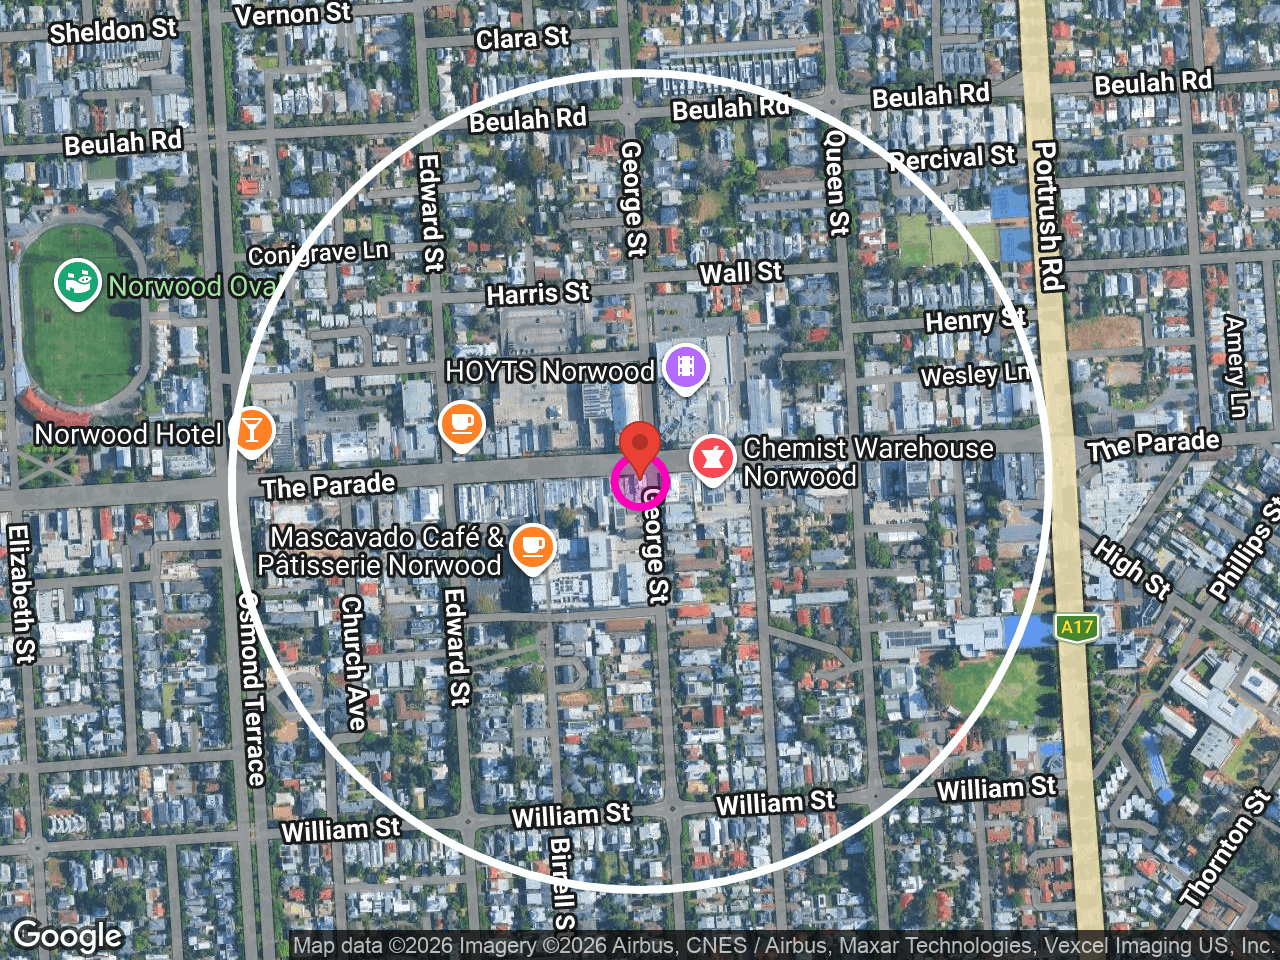
3/196 The Parade sits in prime Norwood Parade food and entertainment territory: street-frontage, corner-style exposure, near Hoyts Norwood and Norwood Place, with more than 400 businesses and services within about 400 metres.
The clearest leasing story is fast casual, QSR and specialty food first, then premium grocery/fresh food and selected personal services. The raw Tenant Finder rank puts butcher/meat at the top because the category has strong demand and white space, but the site context changes the order. This part of The Parade is a restaurant, night-out and high-frequency food precinct. A butcher can still be a credible premium-fresh-food angle; it should not be the lead recommendation.
The data points to five useful conclusions:
- Norwood behaves like a destination, not just a local catchment: about 3.38M annual visits come from the 5–10 minute drive market, and about 868k more come from beyond ten minutes.
- The immediate precinct is the asset: the site sits near the centre of The Parade’s dining, retail, entertainment, health and service cluster.
- Food is the lead leasing lane: QSR demand is strong, afternoon/evening/weekend trading periods are strong, and the site sits in a part of Norwood where customers already come for food and nights out.
- The customer base has quality as well as volume: Urban Renters provide frequency; Wealthy Suburbs, Affluent Family Suburbs and Comfortable Empty Nesters add wallet depth.
- Cross-visitation supports the precinct story: the strongest same-day interactions are concentrated within a few hundred metres of the site, showing customers moving through the heart of The Parade rather than visiting the tenancy in isolation.
How We Would Pitch the Site
Pitch the site as a high-street Norwood Parade food and service opportunity with destination pull. The centre of gravity is not a quiet local strip; customers are already travelling to Norwood for dining, entertainment, shopping and services.
The lead message to tenants should be simple:
- High-street food context: The Parade already has the customer expectation and trading rhythm for food-led operators.
- Destination draw: the 10-minute drive band generates slightly more visits than the 5-minute drive band, and nearly one million annual visits come from beyond ten minutes.
- Repeat local base: Urban Renters and nearby established households give the site regular weekday and weekend demand.
- Best-fit categories: fast casual, QSR, specialty food, premium grocery/fresh food, health/wellness and selected personal services.
Key Terms
- Observed customers: estimated unique customers observed using the location over the moving annual period.
- Visits: unique day visits observed over the moving annual period. This is closest to a traffic-counter style measure, but based on observed customer movement rather than a door counter.
- 5-minute walk market: residents plus workers in the immediate walkable catchment.
- 5-minute drive market: resident demand within a five-minute drive time. The annual retail spend figure is the yearly retail spend of people in that drive-time market.
- Pass-by customer spending power: the annual spending power of customers observed around the site over the past 12 months. Read it as the customer wallet already moving through the strip.
- Sales-equivalent value: observed customer behaviour converted into the annual sales level a comparable retail centre would typically support from that engagement. Use it as a comparative retail benchmark, not reported tenant turnover.
Site Context
3/196 The Parade is a street-frontage tenancy in the central Norwood Parade precinct, close to Norwood Place, Hoyts Norwood, retail services, dining venues and health operators.
Within about 400 metres, the analysis identifies more than 400 nearby businesses and services, including about 110 retail outlets, 105 dining venues and 26 health services. Norwood Place is about 100 metres away. The site also sits close to The Parade’s main road movement, bus stops and nearby parking/access points.
That setting matters more than the raw category rank. A high-scoring category still has to make sense for this exact part of Norwood. Here, the stronger commercial read is food-led: fast casual, QSR, specialty food and premium everyday food concepts that can use the evening/weekend rhythm and the broader destination pull.
Tenant Finder
Tenant Finder combines category demand, brand-location fit, white space, nearby stores and site context, then uses brand benchmarks where available to identify operators worth a leasing conversation. For Norwood, the power is in moving from broad categories to brand-fit conversations that suit The Parade’s food, entertainment and high-street customer pattern.
Priority 1 — Fast casual, QSR and specialty food
This is the lead recommendation. The site sits in a strong food, entertainment and evening/weekend precinct. QSR demand is substantial, with approximately $72.5M of annual QSR spend in the five-minute drive market and about $647M of QSR spending power represented by observed customers.
The best-fit operator is not generic takeaway. The pitch should focus on quality fast casual, specialty food, healthy bowls/salad, sushi, Mexican, chicken, noodles, premium burger or other differentiated lunch-to-evening formats that can trade from both local repeat customers and destination visitors.
Brand-fit examples to test first include Nando’s, Sushi Train and Roll’d, which have exact brand scorecard support and SA presence. Guzman y Gomez is also a strong conversation from the category-benchmark layer, with SA presence and no store in the primary trade radius. Domino’s appears in the data, but its brand pitch is weaker for this specific site and local competition is closer. The stronger brand-led conversation is therefore quality fast casual first, not generic takeaway.
Priority 2 — Premium grocery, health food and fresh food
Health/organic grocery and small grocery/convenience both screen well, and the customer mix supports better everyday food. Urban Renters provide frequency; Wealthy Suburbs and Affluent Family Suburbs add spend depth; Empty Nesters and retirees support trusted specialty food and health-led retail.
A premium fresh-food operator can still work here. The key is positioning: curated food, prepared meals, premium pantry, health grocery, bulk foods, supplements or a polished fresh-food concept — not a plain category answer driven only by white space. Brand examples with SA presence include Go Vita, Nutrition Warehouse, The Source Bulk Foods, FoodWorks and selected premium convenience/grocery formats. They should not outrank the food-led story unless the offer is compact, premium and credible for The Parade.
Priority 3 — Butcher / meat as a premium-fresh-food angle
The butcher/meat signal is real: the category has approximately $35.6M of annual spend within five minutes by car, about $310M of spending power represented by observed customers, and no observed butcher/meat stores in the primary 2.5 km catchment.
That does not make it the lead recommendation for this site. In this location, a butcher only makes sense if it behaves like premium food retail: prepared meals, ready-to-cook, gourmet meat, strong presentation, high street fit and the ability to pay Norwood Parade rents. Treat it as a selective opportunity, not the headline.
Priority 4 — Barbers, beauty and personal services
Barbers and personal services remain credible because they use repeat local visits and weekend movement. Kingsmen Hair and Tommy Gun’s are useful barber examples with SA presence in the benchmark layer. These are secondary to food, but useful if the leasing strategy wants a service-led tenant.
Reachable Market
The immediate walk market contains approximately 6,100 residents and workers. Urban Renters dominate the five-minute walk market, with about 4,365 residents and workers after the worker adjustment. That gives the site a strong nearby base for food, convenience, health, beauty and service missions.
The five-minute drive market contains around 41,500 residents and approximately $1.12B in annual retail spend. The main nearby resident groups are Urban Renters, Wealthy Suburbs, Regional Retirees, Comfortable Empty Nesters and Affluent Family Suburbs.
The ten-minute drive market broadens the opportunity to about 124,000 residents and approximately $3.27B in annual retail spend. The ten-minute market adds more Affluent Family Suburbs and Urban Professionals, which strengthens the case for restaurants, fast casual, wellness and premium everyday retail.
The useful leasing message is: the site has a strong local base, but the Norwood destination role gives it more than local support.
Addressable Market
The observed customer market is the major strength. Over the past 12 months, the site recorded approximately 369k observed customers and 4.42M annual visits. That equates to roughly 12 visits per customer per year.
The travel pattern is the key insight. The five-minute walk, five-minute drive and ten-minute drive bands together generate about 3.55M annual visits, or roughly 80% of total visits. The ten-minute drive band alone generates about 1.75M visits, making it the largest origin band. Beyond ten minutes, the site still draws approximately 868k annual visits from the 15-minute, 30-minute, regional, interstate and international catchments.
That is a different story from a purely local convenience site. Norwood pulls people from a broad area. The right tenant can trade from nearby repeat customers and destination visitors who are already choosing The Parade for food, shopping, services and nights out.
Customers observed around the site represent about $9.8B of annual spending power. The strongest pass-by spend categories include restaurants, QSR, fresh fruit and vegetables, butcher, grocery, pharmacy, alcohol, bakery and selected services.
Sales-equivalent value is approximately $79.9M. Use that as a comparative retail benchmark for the precinct’s customer engagement, not as a turnover claim for this tenancy.
Customer Segments
The useful comparison is not just who lives nearby; it is who actually shows up. Norwood has both: a large inner-east resident base close to the site, and an observed customer base that brings frequency, affluence and established household spend into the precinct.
The nearby market has a clear quality signal. In the five-minute drive market, around 34% of residents have tertiary education, compared with about 22% nationally. Outright home ownership is also above national average, and private-school presence is materially higher than the national benchmark. That supports a better everyday-retail story rather than a purely value-led convenience story.
Urban Renters are the core frequency segment. They are the largest reachable group and the largest observed customer group. In the observed market, Urban Renters account for about 106k customers and 1.62M annual visits. Nearby, they are concentrated in the inner-east apartment, townhouse and smaller-household market around Norwood, Kent Town, Stepney, Maylands and adjoining streets. They are younger, more likely to rent, more urban in their routines, and highly relevant to quick food, takeaway, coffee, health, beauty, grooming, convenience and small-format services.
Wealthy Suburbs and Affluent Family Suburbs add the premium household layer. Together they contribute about 75k observed customers, 1.23M annual visits and roughly $24.5M of sales-equivalent value. These are higher-income, educated households from the established inner-east catchment: families, professionals and owner-occupiers who will pay for quality, trust, provenance and convenience without wanting a mass-market feel. They strengthen the case for better dining, premium grocery, specialty fresh food, wellness, pharmacy-adjacent uses, beauty, household services and family-friendly casual dining.
Comfortable Empty Nesters and Regional Retirees are important repeat users. They generate about 745k annual visits and about $13.4M of sales-equivalent value combined. This is the stable, established household layer: older residents and long-term locals who value service quality, ease, familiarity and trusted operators. They matter for daytime food, pharmacy, health, allied health, fresh food, specialty grocery, cafe-led missions and personal services.
Urban Professionals become more visible in the ten-minute market. They are not the largest observed group, but they help explain the evening and destination-food opportunity. They are more relevant to after-work meals, quick dinner, coffee, drinks, fitness/wellness and polished convenience than to large-format retail.
The segment mix explains why the site should not be framed as one-dimensional. It has local frequency from urban renters, premium spend from affluent and established households, daytime loyalty from older repeat users, and a broader destination-food audience. That is why food-led operators should lead the recommendation, with premium everyday retail and personal services behind them.
Customer Engagement
The engagement pattern supports a food-led and service-led tenant mix. Afternoon is the strongest daypart, with approximately 1.28M annual visits, followed by evening at about 1.00M. Morning and lunch are also meaningful, so the site has multiple trading windows rather than one narrow peak.
Saturday and Friday are the strongest days, with Saturday around 799k annual visits and Friday around 743k. The strongest individual periods include Saturday afternoon, Friday afternoon, Thursday afternoon, Wednesday afternoon, Monday afternoon, Friday evening and Saturday evening.
The trend line adds a useful point. The sales-equivalent benchmark has moved from about $73.5M to about $79.9M across the report period. That growth is not coming from a simple surge in visit count; annual visits are broadly steady at about 4.42M. The stronger story is that the customer base has widened, from about 340k to about 369k observed customers, while average dwell has increased from around 2.3 minutes to about 4.3 minutes.
That is commercially useful. More customers are being observed around the site, and they are spending longer in the precinct. For a Norwood Parade tenancy, that supports operators that can convert dwell and destination behaviour into spend: fast casual, QSR, specialty food, premium convenience, health/wellness and repeat personal services.
Cross-Visitation and Precinct Movement
Same-day movement supports the precinct story. Customers are not only passing the shopfront; they are moving between the site and the recognised anchors around the centre of The Parade.
Norwood Place is the strongest named same-day anchor, with about 265k cross-visits, or roughly 6.0% of site visits. That is exactly the kind of evidence an agent can use: the target site sits beside a known shopping anchor, not on the edge of the precinct.
The next strongest movement sits around the blocks immediately north and east of the site. The Norwood Place / Harris Street side of the precinct records about 253k same-day visits, or roughly 5.7%. The Parade Central / Hoyts Norwood block around 177–193 The Parade records about 131k same-day visits, or roughly 3.0%. Norwood Town Hall adds another recognised nearby anchor, with about 69k cross-visits, or roughly 1.6%.
There is also meaningful crossover along the immediate Parade frontage, including the blocks around 156 The Parade, 166 The Parade, 168–178 The Parade and 206–208 The Parade. The practical read is simple: customers are moving east and west along the retail strip, not treating the target as an isolated stop.
For leasing, that is one of the strongest parts of the story. The site is plugged into Norwood Place, Hoyts/Parade Central, Town Hall and the surrounding dining/service strip. That supports food, QSR, specialty food, premium convenience and personal-service operators that benefit from shared trips and pre/post-dining, cinema, shopping and service movement.
Category and Tenant Pitch Plays
Fast casual / QSR / specialty food
Lead with this. The site has the strongest fit where a tenant can trade from Norwood’s dining and entertainment role: lunch, dinner, weekend, takeaway and quick-service missions. Use the destination-draw data, evening/weekend rhythm and nearby food context as the proof.
Best-fit operator type: quality fast casual, specialty Mexican/chicken/sushi/burger/salad/noodle, premium takeaway, dessert or lunch-to-dinner formats. Full-service restaurant should not be the first model-driven target here: the surrounding supply is already deep and typical format size is larger than this tenancy.
Premium grocery / health food / specialty fresh food
Pitch this as a premium everyday-food opportunity for Norwood’s urban and affluent nearby market. The category should be curated and high-street appropriate: better pantry, health, supplements, bulk foods, prepared meals, gourmet fresh food or premium convenience.
Best-fit operator type: compact health-food grocer, premium pantry, supplements/nutrition, bulk foods, prepared-meal operator or polished fresh-food specialist.
Butcher / meat
Use this selectively. The data says there is demand and white space; the site context says the offer must be premium and presentation-led. This is not a standard suburban butcher pitch.
Best-fit operator type: gourmet butcher, prepared-meal butcher, premium meat/fresh-food operator or hybrid food-retail concept that can sit comfortably beside dining and entertainment uses.
Barbers / personal service
Keep as a secondary service option. The customer frequency and weekend rhythm work, but this is less powerful than the food-led story.
Best-fit operator type: quality barber, grooming, beauty service, wellness service or tightly formatted personal-care operator.